Mapping the post-2015 development debate – join in!

A guest post from the ever inspiring Joe Mitchell – cross-posted from Joe’s blog

“The post-2015 development agenda debate is generating a lot of words on what should follow the popular Millennium Development Goals (or MDGs) come 2015, which is the point at which they were supposed to have been met. There are hundreds of international meetings going on, as well as global and national consultations, plenty of think-tank reports, op-eds and news coverage.

But for someone who’s interested in the discussion – and how decisions are being taken – it’s hard to keep up with what’s going on. So, inspired by an earlier effort by Jan Goossenaerts, I’ve started a new graph of the debate. It tries to bring disparate strands of the debate together in one place.

This is just a start. There is a vast amount of information missing. I’ve mainly based it so far on stories from my twitter timeline – there are many more voices out there, particularly in developing countries.

I have so far only mentioned a few specific goal suggestions – those made in Save the Children’s recent report. There must be more to add. And although it does seem like there will be a new set of goals (perhaps up to 2030), there is still room for a debate as to whether goals are the right tactic for improving global outcomes, or whether there are other ways of approaching the agenda.

There is also much to be discussed in terms of delivery and accountability. If the world isn’t going to meet the Millennium Development Goals by 2015, what’s to say any new goals will be met?

So join in. Anyone can edit the graph above. DebateGraph is a fantastic tool, which allows many layers of debate, critique and argumentation. Give it a go: sign up, navigate back to the post2015 map and start adding material, links, or refining what’s already there.”

Visualizing the Romney Tax Debate

A BlogPoster from DebateGraph

Helping Kids in Poverty Find Work

Debategraph connected recently with Dan Bassill, founder and president of the Tutor/Mentor Institute LLC and the Tutor/Mentor Connection.

Dan has been working with inner-city youth in Chicago for more than 36 years and also had a 17 year career in corporate advertising with the historic Montgomery Ward Corporation.

Drawing on his advertising experience, Dan began to address the challenge of helping kids in poverty from a business innovation and marketing perspective, rather than social work or youth education perspective.

In the guest blog below, Dan reflects on some of the lessons learned and challenges ahead, and invites you add your voice to the conversation on the Helping kids born in poverty start jobs and careers Debategraph:

I believe that there are four concurrent strategies that could be applied in every major city in the world as part of a set of collective on-going actions to help reduce the costs of poverty in each city.

(1) Knowledge aggregation and visualization: The Tutor/Mentor Institute has been collecting information since 1993, showing where volunteer-based tutor/mentor programs are needed, why they are needed, what different programs do, and why business, philanthropy and others should support the growth of such programs as a strategy for expanding social capital surrounding youth in high poverty neighborhoods of large cities like Chicago, New York, and London. Aggregating and sharing the accumulated knowledge and insights can help the whole community to make faster and more effective progress – and save people from having to “reinvent the wheel” each time a new initiative starts. Using interactive sites like Debategraph, new ideas can be added to the library on an on-going basis, and embedded on the websites of any stakeholder organization around the world – allowing others to discover and build on innovative local solutions to poverty, poorly performing schools, drop out programs and workforce development that have already been implemented elsewhere.

The Tutor/Mentor Institute has also been experimenting with interactive geographical maps that can be used to locate tutor/mentor programs in specific parts of Chicago, and to determine the level of program availability in all parts of the city; making it easy for parents, volunteers and donors, as well as corporate leaders, city planners, marketers and policy makers to connect with the programs.

(2) Increasing public awareness: getting information is just the first challenge, getting millions of people to look at this information and use it in their own actions, is a bigger challenge. While I was working at Montgomery Ward our weekly ads drew shoppers to more than 400 stores, across 40 US states. Since no non-profit has the type of advertising budgets that large corporations have, we have to find creative and engaging ways to draw attention to tutoring/mentoring and the information hosted by the Tutor/Mentor Institute and others. One strategy for creating public awareness has been to organize events such as Tutor/Mentor Leadership and Networking Conferences, held every May and November since 1994. Such events draw 100-150 leaders and stakeholders together in Chicago but create much larger visibility during the months building up to the event. Forums like Debategraph enable the Tutor/Mentor Connection to connect its ideas to people in cities all over the world and to build on the contacts and dialogue between the conferences.

(3) Creating learning circles. Facilitating understanding: The amount of information is overwhelming. That’s an obstacle that can be overcome if volunteers are recruited to help others navigate and learn to use the resources of the library. The Tutor/Mentor Institute focuses on structured, volunteer-based tutor/mentor programs as a core part of its strategy because of the way such programs connect volunteers from the business community and who live beyond poverty with youth who do live in poverty. An organized tutor/mentor program can be a collective effort of many extra people working to help kids grow up. As volunteers stay with youth for one or more years many begin to bond and take on roles similar to “surrogate parents”. Such people become advocates and do much more to help the kids, and the tutor/mentor programs they are part of. Over time such people can become full-time advocates for expanded strategies to help poor kids to careers.

As we aggregate more and more information and increase the number of people who engage with the Tutor/Mentor Institute web sites, there also needs to be a process of facilitation, where people who know more about the information available in the knowledge base help others find and understand the information. In Chicago Interns have been writing blog articles and creating visualizations to help build understanding of this information. If you would be interested in volunteering as intern or discussion leader online, please let me know.
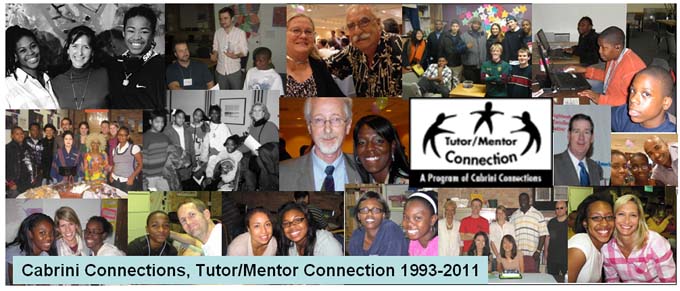
(4) Accelerating the flow of resources: The first three steps create a positive feedback loop as more people begin to use their time, talent and resources to support one or more tutor/mentor programs and, in turn, draw more people and resources into the movement in cities around the world. The information we share can be used by anyone, and the way we innovate public awareness strategies to motivate people to look at this information regularly, and to motivate people to act as volunteers and donors, can sustain this effort for many years into the future.

This not something that was created by the Mayor, the President or funded by a massive government or private foundation grant. The ideas in the Tutor/Mentor Institute were developed over a period of 35 years in response to what we learned as we struggled each year to find resources to operate one single small tutor/mentor program in Chicago. We have demonstrated the potential of the Internet, where people who “don’t have power, don’t have celebrity standing, and are not the elected leaders of a region can put their own ideas for building a better world on the Internet and invite others to join with them in making those ideas a reality.

It’s an idea in tune with our times: and if the idea of helping kids in poverty find work appeals to you, you are welcome to join us.

Controlling Persistent Infectious Diseases

The first in a quick series of posts to catch-up on some of our projects in 2011 so far.

At the start of March 2011 I was privileged to map a 5-Day workshop on “Modelling and analysis of options for controlling persistent infectious diseases” at the Banff International Research Station for Mathematical Discovery and Innovation; part of the breathtakingly beautiful Banff Centre in Alberta, Canada.


The workshop gathered 40 leading mathematical modellers, infectious disease researchers, clinicians and public health officials from around the world to explore the past and future contribution of the mathematical modelling to public health policy, the priorities for future research, and potential ways to enhance the relationship between the research community and public health officials.

Debategraph was used throughout the five-day workshop to the map the live discussions and to facilitate the group dialogue around the key points arising – with group members contributing directly to the map as the workshop proceeded.

The map resulting from the discussions – which the group is continuing to develop beyond the workshop – is embedded below:

Mapping the Amsterdam Declaration

The World Congress on Information Technology 2010, which began in Amsterdam earlier today, brings together over 2,000 leading figures from industry, government, and academia from over 90 countries to address the global challenges of economic, environmental and social development.

The speakers include: Paul Otellini(Intel), Stephen Elop (Microsoft), Pierre Hessler (Capgemini) , Michael Fries (Liberty Global), Neelie Kroes (Commissioner Digital Agenda European Commission), Martin Lees (Secretary-General Club of Rome), Francisco Ros Perán (Secretary of State for Telecommunications, Spain),  Tony Clement (Canadian Minister of Industry), Datuk Seri Ongkili (Federal Minister of Science, Technology and Innovation, Malaysia), Kumar Parakala (KPMG), Peter Sondergaard (Gartner), Virginia Rometty (IBM), Sachin Pilot (Ministry of Communications and Technology, India), Maria van der Hoeven (Minister of Economic Affairs, Netherlands), Sylvia Roelofs (ICT-Office), and William Kennard (US Ambassador to the European Union).

The conference is building towards the Amsterdam Declaration, which calls on all participants to pursue ambitious goals for the use of information technology in addressing economic growth, greenhouse gasses, the quality of life, and ensuring the global impact of these benefits.

All organisations supporting the Declaration of Amsterdam are asked undertake at least one major project in the spirit of the Declaration, and to report back on its progress and achievements at WCIT 2012  in Montreal.

As part of this process, Debategraph is working with the conference to map the Amsterdam projects and their relationships to the overarching goals – with the work-in-progress covering around 60 projects from around the world shown below:

You can follow the proceedings of the conference across the next three days live here and on Twitter via the hashtag: #WCIT2010.

Dissecting the Conservative – Liberal Democrat Coalition Agreement

As part of The Independent’s visual mapping of the election and its aftermath, we have broken down the Conservative – Liberal Democrat Coalition Agreement into an interactive visual graph that lets you comment on and rate each of the proposals.

By surfacing their shared agenda for the next Parliament explicitly in this way, the Conservatives and the Liberal Democrats  have given the electorate an unusually swift and detailed opportunity to give feedback on the proposals they have drawn together in our name.

Both parties have also indicated the desire to open public policy deliberation to wider public input online during the coming parliament; so it’s a timely opportunity as well to consider to what degree—under the intense pressure they faced and in a closed rather than an open process—the party negotiating teams were able to find an agreement close to a mutual optimum.

As well as rating and commenting, you can use the interactive graph to add arguments for and against the Coalition proposals and to suggest alternative ideas that might have been missed.

So, in the new spirit of collaboration, what do you make of the agreement?

CNN, Amanpour and Debategraph

As you may have spotted already, the collaboration between Amanpour and Debategraph launched on CNN last night, with Christiane’s new live global program featuring interviews with the Secretary General of Nato and the Prime Minister of Spain.

If you missed lat night’s episode, it’s available via Podcast here.

Debategraph’s working with Amanpour’s production team and viewers to create debate maps around the interviews and global issues addressed in the programs – and to provide a forum for non-linear, interactive and cumulative debate to complement the program’s thought-provoking analysis and interviews with the global leaders confronting those issues.

Christiane’s aims for the program “to offer multiple perspectives… and serve as the hub for a global community of inquiring minds, hungry for a more daring perspective and a strong, clear, thoughtful take on international stories” emphasize the resonance between our mutual approaches and the reason why Peter and I are delighted to be collaborating with Amanpour’s New York based production team.

 art_amanpour_cnn

“I want this show to stir the global conscience. I have witnessed so much that it’s time to start making real sense of it all”

The program airs on Monday to Thursday at 2100 CET, with a round-up of the best of the week on Fridays on CNN International and Sundays on CNN in the United States – and tonight’s show features interviews with Tony Blair, Terje Roed-Larsen (UN Middle East Envoy), Dan Meridor (Israeli Intelligence Minister), and Saeb Erakat (Chief Palestinian Negotiator).

In conjunction with the launch of program, Peter and I have released a new interface for Debategraph (which will also feature  in the forthcoming WAVE climate change project for the European Commission). More on both later — but for now here’s a quick video introduction to the new Debategraph Stream interface:

Reblog this post [with Zemanta]

Collaborative Democracy in the White House

If you have been following the White House’s groundbreaking Open Government Initiative over the past few weeks, you’ll be aware already that Debategraph has been mapping the proposals emerging from the Open Government Brainstorming sessions on Participation, Transparency and Collaboration.

WhiteHouseDebategraph

The Open Government Initiative moved into the third, and most significant, Drafting phase today—and we’re delighted to note that the White House’s Open Government team has entrusted this vital phase to our favourite wiki team at MixedInk (who, if you haven’t discovered them yet, offer a truly innovative and powerful approach to the task of collaborative writing, which is ready to be applied in multiple contexts).

The initial Open Government Brainstorming and Discussion phases have been stimulating and generative, but the real collaborative work, the real collaborative responsibility, and the real collaborative opportunity lie in the next phase of synthesis.

So get writing!

…and, to help you on your way, here’s the combined Debategraph of the redacted proposals from the three brainstorming sessions:

Reblog this post [with Zemanta]

Crowdsourcing Public Services 2.0

In November 2009, the EU Ministerial declaration on eGovernment will be published at the Malmo conference.

Building on the Public Services 2.0 workshop in Brussels early this year, and at the initiative of David Osimo and Paul Johnston, we are teaming up other partners to crowdsource an Open Declaration on Public Services 2.0 to sit alongside November’s ministerial declaration.

EUPSbanner

Echoing the Open Government initiatives currently underway at the White House, the process is beginning with an open brainstorming session to identify and evaluate a range of ways in which EU governments can harness the emerging power of the web to transform European public services.

We would love you to participate in this process by adding your suggestions and voting for others here before 15th July.

More details, including the plans for the second collaborative phase and the subsequent public endorsement are available here.

…and, in parallel with the formal process, I’ll be keeping an informal eye on the proposals as they develop via the debate map below:

Reblog this post [with Zemanta]

Mapping the Power of Information Taskforce Report

poiwordletwo

As a follow up to the Public Services 2.0 workshop in Brussels last month, and in keeping with the collaborative ethos and intention of the event, Richard Stirling, one of the Cabinet Office secretaries to the Power of Information Taskforce, asked me to receate the Taskforce’s landmark report in Debategraph.

The initial map (shown in the Debategraph Explorer view above) foregrounds the report’s recommendations—although the full text of the report is also included in the expanded text of the relevant elements on the map (which you can view by clicking on the Green + button above).

Once in this format, anyone can comment on, support or oppose, and rate the individual recommendations—and also begin to increase the granularity of the analysis by, for example, breaking out the arguments presented in the report in support of the recommendations by the Taskforce.

This Explorer view of the report (above) can also be shared and embedded on blogs and other websites using the following code:

<iframe src=’http://debategraph.org/flash/fv.aspx?r=14255&d=2&i=1′ frameborder=’0′ width=’450′ height=’600′></iframe>

As ever feedback about the work-in-progress, either directly on the map, or in the comments below, will be very welcome—and, in the meantime, for a quick insight into the way that the ideas articulated in the Power of Information Taskforce’s report are percolating in the US, check out Ellen Miller’s Sunlight Foundation blog.

Reblog this post [with Zemanta]