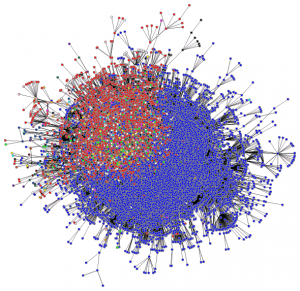
Mapping the post-2015 development debate – join in!

A guest post from the ever inspiring Joe Mitchell – cross-posted from Joe’s blog

“The post-2015 development agenda debate is generating a lot of words on what should follow the popular Millennium Development Goals (or MDGs) come 2015, which is the point at which they were supposed to have been met. There are hundreds of international meetings going on, as well as global and national consultations, plenty of think-tank reports, op-eds and news coverage.

But for someone who’s interested in the discussion – and how decisions are being taken – it’s hard to keep up with what’s going on. So, inspired by an earlier effort by Jan Goossenaerts, I’ve started a new graph of the debate. It tries to bring disparate strands of the debate together in one place.

This is just a start. There is a vast amount of information missing. I’ve mainly based it so far on stories from my twitter timeline – there are many more voices out there, particularly in developing countries.

I have so far only mentioned a few specific goal suggestions – those made in Save the Children’s recent report. There must be more to add. And although it does seem like there will be a new set of goals (perhaps up to 2030), there is still room for a debate as to whether goals are the right tactic for improving global outcomes, or whether there are other ways of approaching the agenda.

There is also much to be discussed in terms of delivery and accountability. If the world isn’t going to meet the Millennium Development Goals by 2015, what’s to say any new goals will be met?

So join in. Anyone can edit the graph above. DebateGraph is a fantastic tool, which allows many layers of debate, critique and argumentation. Give it a go: sign up, navigate back to the post2015 map and start adding material, links, or refining what’s already there.”

Visualizing the Romney Tax Debate

A BlogPoster from DebateGraph

Mapping the Political Contours of Cyberspace

William Gibson coined the term “cyberspace”, for his 1982 short story Burning Chrome to create a “a narrative engine, and a territory in which the narrative could take place”. Twenty years on, cyberspace is the world’s narrative engine: and an uncharted territory to which the world is still coming to terms.

Political, industrial, and civic leaders are gathering at the Foreign Office’s London Conference on Cyberspace next week to think through the implications, opportunities and contradictions of this emerging world.

The conference will explore key themes – prosperity; social good; freedom of access and expression; cyber crime and international security – with the aim of deepening mutual understanding and beginning to outline a political, social and economic strategy to secure the benefits of cyberspace while addressing the concomitant threats to personal and national security.

The Foreign Office would like the dialogue at the event and online to be as broad as possible – and, in support of this process, Debategraph will be mapping and curating the dialogue as it unfolds live and online.

To start exploring the map – which we have seeded with the initial framework of the conference – click on the small bubbles to move deeper into the debate and on the larger bubbles to move back up.

You can gain an insight into the range and scope of the debate by watching the map evolve here, but you are welcome to add your voice to the debate online by adding new ideas and comments to the map and by rating the ideas, or by suggesting new ideas and questions via Twitter using the #LondonCyber hashtag and/or the Foreign Secretary’s Facebook channel (both of which we will be monitoring as well).

As discussed before, the whole structure of the map is like a wiki – every aspect is provisional, and open to further refinement – and everyone can add new issues, positions, arguments and evidence to the map.

The aim is to weave together all of the arguments into a rich, transparent, non-linear structure that anyone can explore and understand quickly.

As with the other maps in the The Independent series you can keep up to date with developments via @TheIndyDebate on Twitter, and you are welcome to embed the map (like a YouTube video) on your own site or blog using the code shown below:

*Cross-posted at: The Independent

Mapping the Amsterdam Declaration

The World Congress on Information Technology 2010, which began in Amsterdam earlier today, brings together over 2,000 leading figures from industry, government, and academia from over 90 countries to address the global challenges of economic, environmental and social development.

The speakers include: Paul Otellini(Intel), Stephen Elop (Microsoft), Pierre Hessler (Capgemini) , Michael Fries (Liberty Global), Neelie Kroes (Commissioner Digital Agenda European Commission), Martin Lees (Secretary-General Club of Rome), Francisco Ros Perán (Secretary of State for Telecommunications, Spain),  Tony Clement (Canadian Minister of Industry), Datuk Seri Ongkili (Federal Minister of Science, Technology and Innovation, Malaysia), Kumar Parakala (KPMG), Peter Sondergaard (Gartner), Virginia Rometty (IBM), Sachin Pilot (Ministry of Communications and Technology, India), Maria van der Hoeven (Minister of Economic Affairs, Netherlands), Sylvia Roelofs (ICT-Office), and William Kennard (US Ambassador to the European Union).

The conference is building towards the Amsterdam Declaration, which calls on all participants to pursue ambitious goals for the use of information technology in addressing economic growth, greenhouse gasses, the quality of life, and ensuring the global impact of these benefits.

All organisations supporting the Declaration of Amsterdam are asked undertake at least one major project in the spirit of the Declaration, and to report back on its progress and achievements at WCIT 2012  in Montreal.

As part of this process, Debategraph is working with the conference to map the Amsterdam projects and their relationships to the overarching goals – with the work-in-progress covering around 60 projects from around the world shown below:

You can follow the proceedings of the conference across the next three days live here and on Twitter via the hashtag: #WCIT2010.

Integrating Debategraph with SharePoint

When you are developing a web application one of the most delightful compliments anyone can pay you is to start building on your work. And when the person building is an expert in multiple fields including your own, your joy is complete.

So a huge thank you today to Paul Culmsee and his colleagues at Seven Sigma Business Solutions for building and releasing the free Seven Sigma Debategraph WebPart for SharePoint – which lets you embed live debate maps into SharePoint sites and tune the display to fit enterprise SharePoint portals.

 mscomsp_logo

Paul, who has written a brilliant series of posts on the value of issue mapping to SharePoint projects, explains the underlying motivation for the web part:

“SharePoint is a terrific product for aggregating disparate information into a single integrated view. However it is oriented around linear, “list based” information, such as calendars, tasks, documents and the like. Argument visualisation tools like Debategraph do an excellent job of exposing the deep structure of complex problems or issues in a manner that makes argumentation and decision rationale accessible.

The Seven Sigma Debategraph web part for SharePoint provides a means to surface Debategraph argumentation maps within SharePoint. Through the release of this web part, Seven Sigma hopes to increase use of argumentation mapping techniques as a means to facilitate cohesive and productive discussions on complex issues.”

To illustrate the potential, and working with fellow SharePoint gurus Andrew Jolly and Ruven Gotz, Paul has created the Debategraph below on SharePoint Governance – which is also the default starting map when you install the web part:

If you are SharePoint user and would like to experiment with the web part, you can download it here – where Paul also provides short video guides on installing and using the web part.

…and if you would like to learn more about the background to the web part and our collaboration with Seven Sigma, read Paul’s characteristically insightful and engaging blog post here.


Reblog this post [with Zemanta]

Obama: Making Sense of the World?

And so the kaleidoscope turns, and we see the world anew.

Or do we?

Barack Obama’s inauguration today as the 44th President of the United States of America, marks the end of a remarkable personal and national journey. Arrival at such a destination is a cause for global celebration. But as with all great journeys the arrival is also only a beginning.

inaugration

Obama is taking a leading role in a world system that is severely perturbed on multiple levels. Such perturbation often proceeds collapse: and can proceed the emergence of a more sophisticated and better-adapted system.

It’s not clear—it never is—to what extent the choice of branching paths is open to us. But it surely behoves us to act as if it is.

My (personal) sense is that we face a mess of complex, interrelated and non-linear problems; sane responses to which lie beyond our existing methods and tools. In essence, we need to re-configure our modes of political thinking and organization to enable us—as local, national, and international communities—to move significantly closer to collective maxima of intelligence (both reasoned and emotional).

For those for whom the analogy is familiar, we’re awaiting The Mother of All Demos in the political realm to match Doug Engelbart’s technological masterpiece 40 years ago (which pre-figured much of the technological landscape that we inhabit and take for granted today). It’s the social dimension of Engelbart’s vision of augmented collective intelligence that lags behind our technological achievements: and it needs to catch up quickly.

The signs are that Obama, and the team around him, are mindful of this. As others have noted already, one of the most encouraging aspect of the Change.gov experiment was the speed at which the interaction on the site improved iteratively across the transition. The challenge now is how to crystallize this process—to enable genuine and deeply collaborative sensemaking—and how to set this process in motion in the first few months of the administration when the opportunity and receptivity to change are greatest—and when the character of the administration will be forged.

Readers of The Independent and others who have joined in developing the Obama and Gaza maps over the last couple of months have demonstrated on a smaller scale and in vitro that different and radically collaborative models of sensemaking are possible—and we are grateful to everyone who has participated directly so far, blogged about and embedded the maps, and to the BBC World Service’s Digital Planet, BBC Technology and PRI’s The World: Technology podcast for their support in spreading the maps more widely.

Both maps will continue to develop as exploratory exemplars of the kinds of cumulative, comprehensive and distillative sensemaking processes that the web is starting to enable—with the Obama map, in particular, shifting to a focus on the first 100 days.

Deeper challenges remain. The emerging set of collaborative sensemaking and deliberation tools of which Debategraph, is one example, are still nascent, still figuring out the basic principles—still more VisiCalc than Excel. The tools require a basic visual literacy that itself is only just beginning to emerge in society. And the maps, and other sensemaking constructs, require time to build and time for reflection in an impatient and attention-poor age.

But, today, of all days, is a day for optimism. The day on which Barack Obama embodies the realization that long journeys towards distant mountain tops can reach the summit.

Cross-Posted at: Independent Minds

Help us map the mind of the blogosphere

Cross-posted from: Independent Minds

To celebrate the launch of The Independent Minds blogs, and as part of our Obama project with The Independent newspaper, we are launching a global experiment to map the mind of the blogosphere.


Source: Matthew Hurst’s Blogosphere Meta-Core.

Not all of it, obviously… not, for example, the part that’s thinking about Britney Spears and Angelina Jolie.

We’re just focusing on the part thinking about the inauguration of the new President and the choices he faces. And we want to transfer the collective insight of the blogsophere into the map that’s already building here.

Can we do it? With your help… yes we can.

We’re not expecting you to learn the pros and cons of argument visualization; though if you want to stretch your mind with something other than a Crossword or Linkudo we’d love to help.

Instead, all you have to do, if you are blogger, is to let us know when you have posted about Obama and any of the policy issues he faces. You can do this in two ways:

(1) Include a link to the map in your blog post:

http://www.independent.co.uk/news/world/americas/article1022466.ece

or,

(2) Embed the map like a YouTube video, using the code below:

<iframe src=’http://debategraph.org/flash/fv.aspx?r=7714&d=2&i=1′ frameborder=’0′ width=’490′ height=’650′ scrolling=’no’></iframe>

Then tag the post TheIndyDebate. When you do this, we’ll detect the post and start to include your thoughts in the map.

Embedding the map will let your readers watch the map evolve in situ on your blog. And, if you link to or embed the map, we’ll publish a reciprocal link (both here and on the Independent Minds blog) back to your blog.

Starting now with: Ideal Government, Contrary Brin, AlwaystheTwain.

If we miss a blog post, email me at david AT debategraph DOT org – and if you’re not a blogger, but know someone who might interested in participating, please pass the links along.

Mapping Obama's Speech in Berlin

As announced on the Global Sensemaking blog, and building on Tim Bonnemann’s excellent Wordle and Mark Szpakowski’s suggestion, I produced a draft map of Barack Obama’s speech in Berlin yesterday, which you can view and explore here.

The snapshot below displays the top layer of the map, and you are welcome to log-in and improve both the top layer and the underlying structure of the first draft.


As noted in the earlier post, the preparation of the first draft of the map emphasised the different senses, dimensions and saliencies of the speech that emerge via the different forms and interpretations: video, transcript, Wordle, and map. And, no doubt, others experiencing Obama’s speech first via TV news analysis, newspaper reports, David Frum, a photograph, or at the speech itself would take away different senses too.

To illustrate how it is possible to develop this kind of mapping analysis further live on the web already, I have started to weave together the map and the transcript of the speech using the Future of the Book’s marvellous CommentPress tool to enable directly addressable, granular access to the text of Barack Obama’s speech, linked to the relevant sections of the map (and vice versa)—with a video clip layered into the latter example for good measure as well.

The granular addressability is shown at the paragraph level in this example; however, CommentPress—which is being applied imaginatively to several public consultations in the UK—allows the user to define a deeper level of granularity, enabling a finer one-to-one correspondence between the source document and the map.

The hope embodied in this experiment is that in the build up to the Presidential election in November it might be possible exemplify the potential of the emerging web technologies to shift the modus of political debate (a degree or two) away from the calculated cacophony of ephemeral soundbites toward a more considered, constructive and cumulative conversation.

If you are willing to help in the pursuit of this goal—working on the transcripts, mapping and tying together the arguments, highlighting inconsistencies and areas of agreement, and holding the candidates transparently accountable to their words—please join us.

ICT for Governance and Policy Modelling

Thanks to David Osimo’s highly recommended blog on eGovernment 2.0, I was in Brussels at the end of last month to present our work-in-progress on Debategraph to the European Commission’s ICT for Governance and Policy Modelling Consultation Workshop Framework Programme VII.

It was a fascinating day, exploring the Information Society Directorate’s long-term research agenda in this field, against a background, outlined by David Broster Head of Unit for eGovernment and CIP Operations, of the movement of web 2.0 tools from the social and professional domain into the political and policy domains (see slide below).

ICT for Participative eGoverance

Among the many excellent and thought-provoking presentations to the workshop, Anthony D. Williams’s (co-author of Wikinomics) on Wikinomics and the Future of Government and Governance, and Andy Mulholland (Global CTO of Cap Gemini) on From National Citizen to Web Citizen, had a particularly powerful resonance from my perspective.

The full set of presentations is available here.

The cluster of institutions working on interrelated projects and arriving at similar conclusions from different angles signalled strong validation for the approach that we are implementing and the goals that we are pursuing, and the enthusiasm with which Debategraph was greeted on the day was tremendously encouraging and much appreciated.

The next big event on the calendar, in Lyon, 25-27 November 2008, is highly recommended to everyone with an interest in eGovernance and eParticipation in Europe.

Government 2.0 – only connect…

“Only connect… Live in fragments no longer.” E. M. Forster, Howards End (1910).

Government 2.0?

The lightweight, collaborative, multiway technologies emerging across the web, and the new patterns of social interaction associated with them, are about to transform the shape of government, our experience of government, and our participation in government. To misquote Clay Shirky: government that’s targeted at you but doesn’t include you may not be worth sitting still for.

But what kinds of government will emerge from this process?

Paul Johnston and the Connected Republic team have been thinking deeply about this, and today published Seven Principles of Government 2.0 that articulate their sense of the ways in which things may be different.

Their suggested principles are:

  1. A less Hierarchical Public Sector: Government 2.0 will have moved away from command and control, devolving much more decision-making to local units and frontline staff.
  2. A Collaborative, Joined-up Public Sector: Government 2.0 will offer a more joined-up face to citizens and will use collaborative models and tools to break down silo barriers, maximise the use of precious resources and dramatically reduce process time cycles.
  3. A Public Purpose Sector: The boundaries of Government 2.0 will be wider and more flexible, enabling creation of public value by a ‘public purpose’ sector which will be much broader and more diverse than the traditional public sector.
  4. Empowered Citizens: Government 2.0 will enable citizens to do more for themselves, either individually or collectively, as co-producers of services and shapers of public policies.
  5. A Feedback-driven Public Sector: Government 2.0 will be radically closer to citizens and will give multiple and real opportunities for feedback, and will ensure the feedback has a real impact in shaping its decisions.
  6. Open and Transparent Government: Government 2.0 will be radically more open and transparent than current models in relation to policy making, service delivery, internal administration and accountability processes.
  7. Facilitative Government: Government 2.0 will see government’s role shift much more towards creating context, orchestrating and facilitating, rather than controlling and delivering, public discourse and service delivery.

In keeping with the spirit of the analysis, the principles are open for discussion on a new wiki on the Connected Republic site.

On your way over to wiki, you might also like to glance at: Personal Democracy Forum 2008: Rebooting the System, From Wikinomics to Government 2.0 (via Don Tapscott), How Web 2.0 can Reinvent Government, and Liza Sabater’s The Cluetrain Manifesto for People Powered Politics.